Dynamic range
The pL-to-pT band moves with the market. Near pL, look for buys or adds. Near pT, look to trim.
Rules-based market levels
StormWatch Signal is a TradingView script that plots four levels on any ticker: pL (Probable Low), pT (Probable Top), sT (Short Term Trend), and T (Trend).
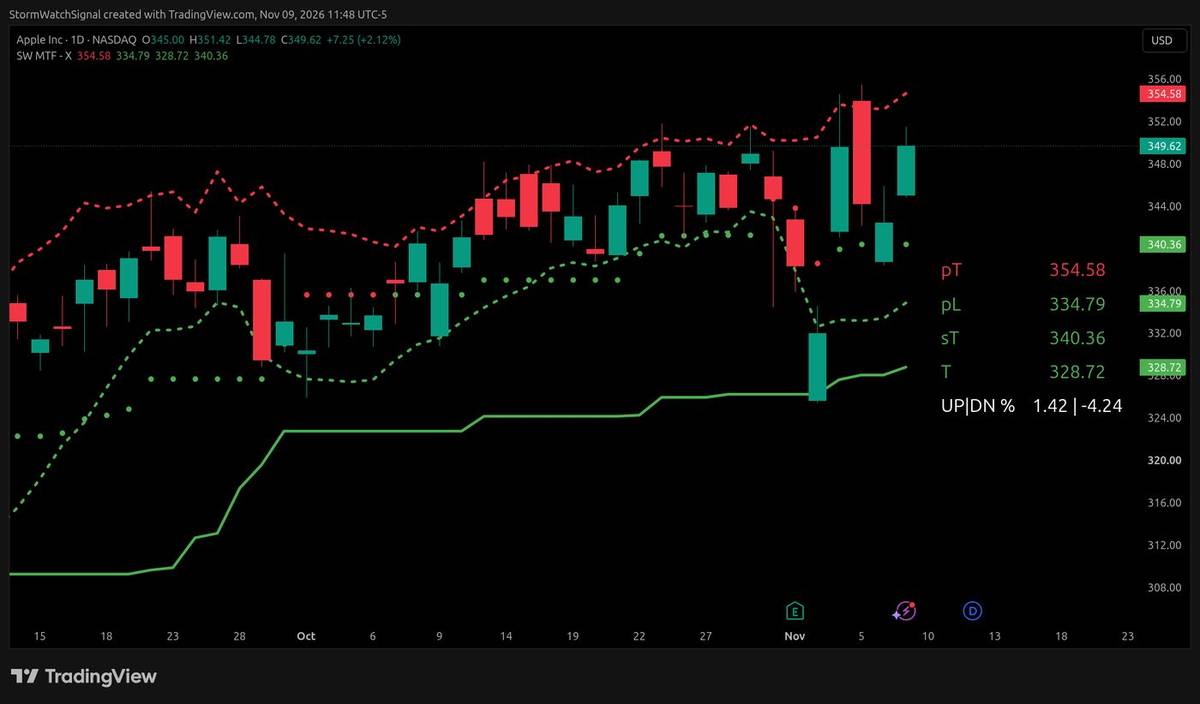
The pL-to-pT band moves with the market. Near pL, look for buys or adds. Near pT, look to trim.
Price above T means the trend is intact. A break below T means the trend is broken — size down.
A dip below pL while still above T reads as oversold, not a trend break.
StormWatch is a TradingView script. Try it free for two weeks (limited-time offer, free TradingView account required). Email your TradingView profile to StormWatchSignal@gmail.com or DM @StormWatchSgnl for access, then run it on any ticker.
Not advice.